By Sarah Whitwell
It has been a year since I first started working on my relational database. For those who have not been following my journey, I have used my time at the Sherman Centre thus far to construct a relational database that supplements my dissertation. This database features information on incidents of racialized violence extracted from the Slave Narrative Collection of the Federal Writers Project, the first-person testimony culled from the Joint Select Committee to Inquire into the Conditions of Affairs in the Late Insurrectionary States, and the records of the Bureau of Refugees, Freedmen, and Abandoned Lands.
Following the initial creation of my database, much of my work over the past year has involved inputting data on incidents of racialized violence – the victims and perpetrators, geographic locations, forms of violence, and methods of resistance. At this time, my database is nearing completion with over a thousand unique records describing the experiences of African Americans in the postemancipation South. The ongoing challenge, however, has been how to showcase this data. And, more importantly, how to showcase it in a way that doesn’t reduce the experiences of African Americans to mere quantitative data.
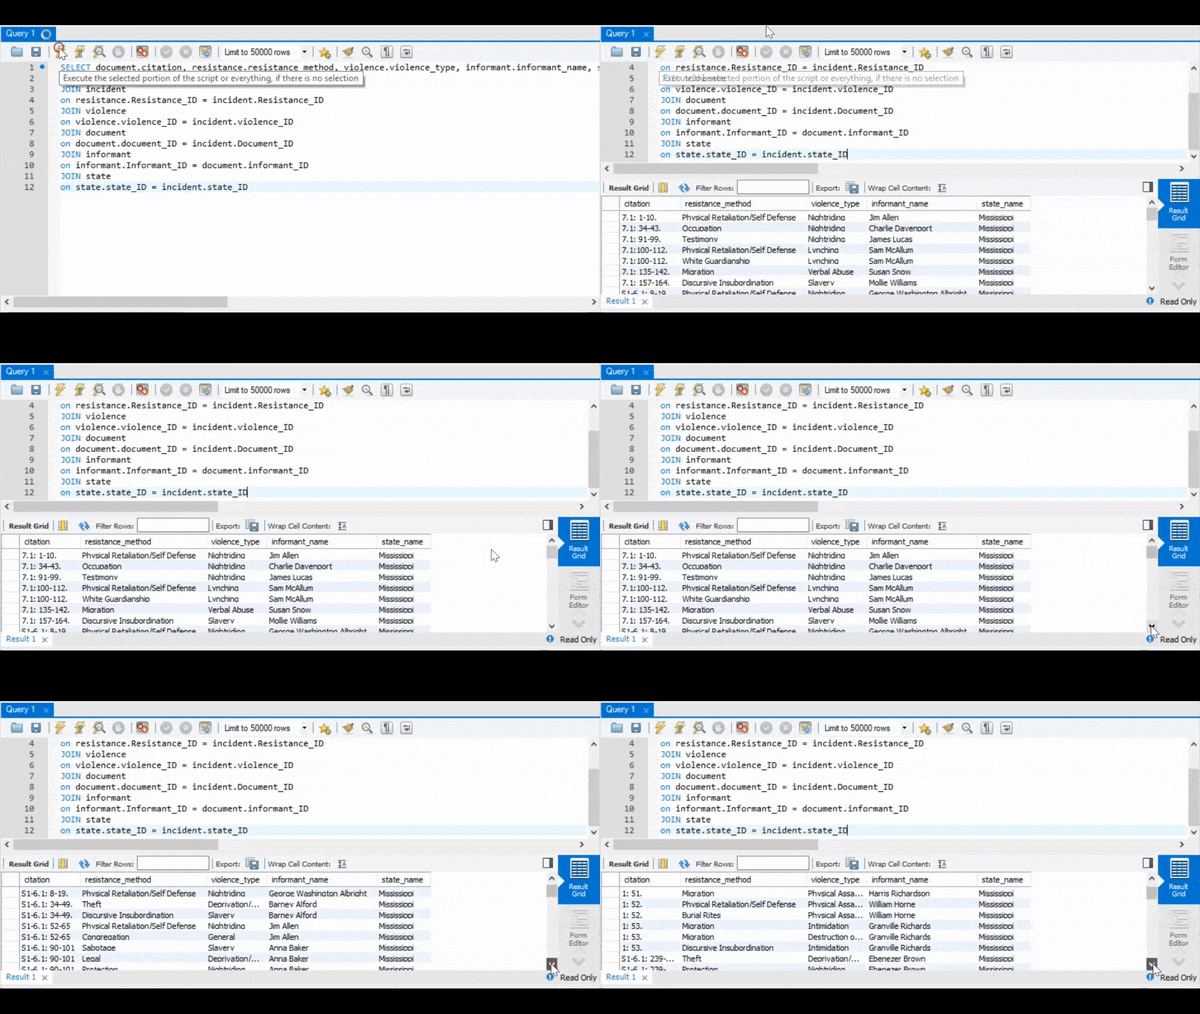
I’ve talked previously about the importance of testimony as a method of resistance. As a result of widespread illiteracy among the black population in the late nineteenth century and early twentieth century, many scholars have falsely assumed that few records exist detailing their experiences. Deborah Gray White lamented the difficulty of studying the lives of enslaved women because they masked their thoughts and feelings to protect themselves from white and male invasion.[1] Yet ordinary black people – including women – did record their experiences, especially those relating to racialized violence. They produced records in ways that made sense to them, which was often in collaboration with state and federal officials.[2] Unfortunately, the process of coding this testimony into a database can easily result in a flattening of the data, as the thoughts and feelings of those African Americans who experienced violence are reduced to keywords (Figure 1).

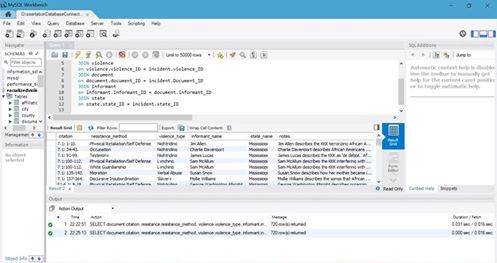
Although my dissertation relies on this database as a way to identify the relationships between specific types of violence and the methods of resistance employed in response, I have not eliminated a more traditional close-reading methodology. My dissertation still embraces the richness of narrative. To accomplish this, I have made a conscious effort to capture the testimony of African Americans within my database. While I breakdown incidents of racialized violence in to keywords, I have also created an important ‘notes’ column that allows me to preserve the testimony alongside the coded data (Figure 2). Because of this, the database can, in theory, stand on its own without the original source material available. Each incident includes a full description of the testimony given and any relevant interpretative notes. While perhaps not a perfect solution, it has ensured that those African Americans who shared their experiences are not reduced to mere names or numbers.

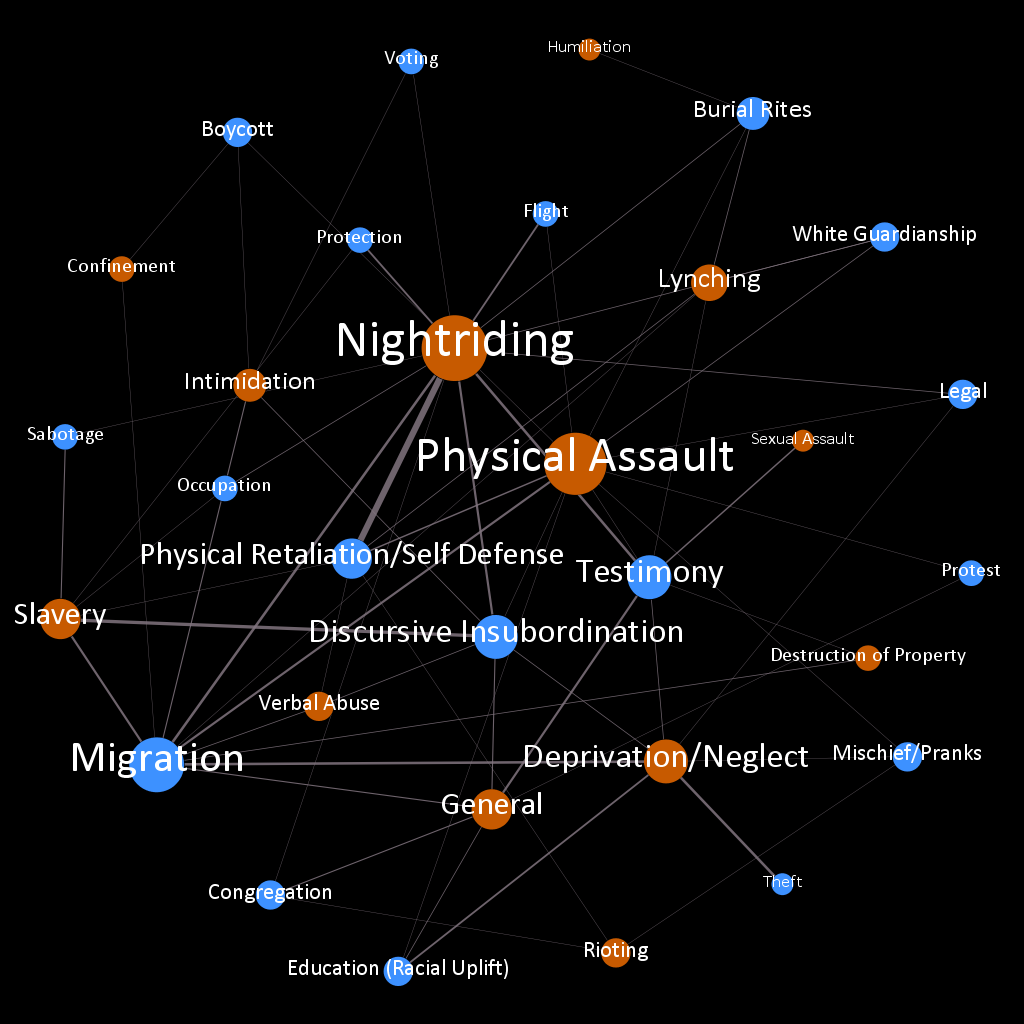
Unfortunately, while I have found a reasonable solution to preserve narrative in my database, I am still struggling to achieve the same with my data visualizations. I truly believe that data visualization is important for this project, as my database is less useful (read: not user friendly) for those not already familiar with structured query language (SQL). I previously created a simple visualization using a small subsection of my dataset (Figure 3). Using Gephi, an open-source network analysis and visualization software package, I was able to map the relationships between types of violence and methods of resistance. The problem, of course, is that this visualization is totally devoid of narrative. The testimony that serves as the basis of my research is lost when it is reduced to simple nodes in a network.

This doesn’t mean that such a visualization is not valuable. I think a network visualization does a fair job of quickly revealing the relative frequency of different types of violence and resistance. But I am concerned because it reveals nothing about the people whose lives make up the network. Therefore, I am currently experimenting with different platforms that will allow me to preserve narrative, while still creating a compelling visualization. I see no reason why I need to rely on a single type of visualization. One possible solution might be to create an interactive visualization, where users can scroll over individual elements to reveal more information. I have done this before using Google Maps, but the limitations of my geographic data (not every incident of violence/resistance is tied to a physical location) makes mapping somewhat problematic. As a result, much of my current work at the Sherman Centre revolves around finding that perfect visualization tool that will let me balance narrative richness with quantitative data.
[1] Deborah Gray White, Ar’n’t I a Woman?: Female Slaves in the Plantation South, Revised Edition (New York: W. W. Norton & Company, 1999), 24.
[2] Kidada E. Williams, They Left Great Marks on Me: African American Testimonies of Racialized Violence from Emancipation to World War I(New York: New York University Press, 2012), 5.

About Sarah Whitwell
Sarah Whitwell is a PhD candidate in the Department of History at McMaster University. Her research explores the efforts of black women to resist racialized violence in the postemancipation South. You can find her on twitter: @whitwese


Leave a Reply